Monitorama PDX 2024
2024
List of videos

Monitorama PDX 2024 - Logs Are Good, Actually
Alex Hidalgo's session from Monitorama PDX 2024. The monitoring and observability space has moved at an extremely rapid pace over the last few years. Part of this is due to legitimate technological improvements in terms of standards, tooling, and advanced vendor solutions. But a large part of why it feels like the space is moving at such a frenetic pace is due to marketing departments and talking heads just like me. While it might feel like there is intense pressure to adopt all of the newest and most advanced concepts that fall into the category of "monitoring" or "observability", I'd like to make an argument for the continued importance of our oldest, and perhaps most important, source of telemetry: the humble log line.
Watch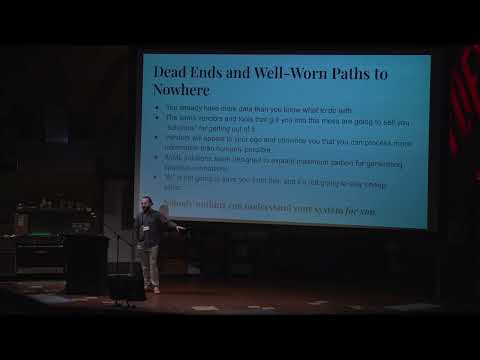
Monitorama PDX 2024 - The Ticking Timebomb of Observability Expectations
David Caudill's session from Monitorama PDX 2024. It’s very easy to convince Engineers and Managers to “monitor everything” — who doesn’t want as much information as they can possibly have about what’s happening in their system? At surface level, this sounds like a great plan. This has become the dominant approach by engineering teams: simply install an agent, sidecar, or SDK, and everything � will be monitored for you. Want to know how your Kubernetes cluster is doing? Here’s 10k “turnkey” metrics! The numbers become gigantic as architectures continue to fragment from monoliths to rocks(SOA) to pebbles (microservices) to…a gaseous cloud of lambdas? Doesn’t matter, add this line and ship dozens of metrics from every single lambda execution. Ship it all, monitor everything, and sort it out later. After all, we can’t possibly know what the cause of an incident in the future might be! Every second of outage costs us money! For every single interaction we capture scientific levels of data, constantly vigilant, expecting at any moment we might need to comb through it to understand a complex outage. The trouble is, this is extraordinarily expensive computationally, cognitively, and financially. The financial and computational cost of this has been subsidized by VC investment in the past, which were in turn subsidized by the historically low interest rates of the 2010s. As you’ve probably noticed, that party is over. The cognitive costs are still subsidized by simply putting on the confident “Serious Senior Engineer” face and pretending we know what all this stuff means. In this talk, we'll cover a little bit of how we got here, the cognitive biases that keep us here, and some specific guidance on better ways to approach these problems in a cost effective way.
Watch
Monitorama PDX 2024 - The Hater's Guide To OpenTelemetry
Austin Parker's session from Monitorama PDX 2024. "If I have to watch one more talk that references xkcd 927, I'll drop our logging db myself." "The only thing I need to trace is my path out of this building at five o'clock each day." Hacker News comments or your personal thoughts on everyone's favorite observability project, OpenTelemetry? The answer may surprise you! In this talk, levity will be enforced and the takes will be piping hot, as you learn about the many ways that OpenTelemetry has been completely abused by the commercial 'observability community', why it didn't have to be this way, and how in spite of the best efforts of many millions of dollars in marketing pablum it's still a pretty good project.
Watch
Monitorama PDX 2024 - Things I wish I knew before we decided to migrate our metrics infrastructure..
Suman Karumuri's session from Monitorama PDX 2024. In this talk, I will delve into the key considerations and valuable lessons learned from transitioning some use cases from a proprietary metrics system to an in-house metrics platform utilizing open-source components. The allure of open-source systems—characterized by their transparency, adaptability, community support, and cost-efficiency—prompted this significant shift. Although theoretically straightforward, the practical implementation of this migration proved to be immensely complex. We initially underestimated the multifaceted nature of the transition, which entailed several simultaneous changes: migrating from StatsD to OTel, mastering the operation of our own metrics store, transitioning from a vendor-specific UI to Grafana, and adopting a new query language, among other significant changes. Beyond the technical hurdles, our team faced cultural and operational challenges. Running a large-scale metrics store was not within our initial expertise, so we had to quickly acquire the necessary operational knowledge. Open source solutions, though powerful, often required extensive tuning to ensure reliability. As our metrics workload grew, we adopted a multi-cluster strategy, which, while scaling our operations, introduced complexities for our developers. To address this, we implemented an additional layer of abstraction, providing multiple clusters as a single cluster to our customers, enhancing usability. Moreover, we encountered challenges related to aggregation, deploying newer open source components, resolving circular dependencies in our in-house Kubernetes and service mesh infrastructure, migrating dashboards and alerts, and ensuring the correctness of tens of thousands of dashboards and hundreds of thousands of alerts. Additionally, it was a significant effort to retrain our engineers on a new query language, adapt to a new UI, and integrate with a new alerting infrastructure, all of which added complexity to our migration journey. Attendees of this talk will gain a deep understanding of the intricacies involved in such a migration, enabling them to better navigate their own journeys when faced with similar challenges.
Watch
Monitorama PDX 2024 - The Observability Data Lake, 1 year on
David Gildeh's session from Monitorama PDX 2024. Last year, we spoke about our vision for the Observability data lake in my talk "How to Scale Observability without Bankrupting the Company". This year we have the system running in production with all of our trace data. This update will discuss some of our learnings, challenges and results putting all of our trace data into the system for Netflix. By June we'll have a lot more to share, so keeping the abstract high level now, we're still considering open-sourcing this so may even use Monitorama to announce that, but no promises as the cost of running an open-source project is quite high so maybe later in the year if June is too soon.
Watch
Monitorama PDX 2024 - The subtle art of misleading with Statistics
Dave McAllister's session from Monitorama PDX 2024. "Lies, damned lies and statistics." While true, only statistics allows you to lie to yourself. Let's explore how statistics can sometimes trick us into believing something that's not true. This isn't always done on purpose; often, we mislead ourselves without realizing it. We'll look at how focusing too much on recent events, choosing specific data to look at, and making assumptions about the size of a group can lead us to the wrong conclusions. We'll dissect common practices like the misuse of graphical representations, the confusion between correlation and causation, and the manipulation of scale and averages. These practices, often overlooked or misunderstood, can result in false indicators, misleading correlations, and distracting information. Through real-world examples, we demonstrate how these statistical pitfalls can shape narratives, influence decisions, and impact public opinion. This presentation aims to teach you how to look at statistics more critically, understand their limits, and avoid fooling yourself with numbers.
Watch
Monitorama PDX 2024 - Is Your Kernel Being Honest? Understanding & measuring low level bottlenecks
Ferris Ellis' session from Monitorama PDX 2024. User-space is a pleasant and happy place. It is full of simple numbers like CPU utilization and memory usage. Numbers that the Linux kernel tells you and swears are true. But beneath user-space lies a deep and dark land that is full of strange caches, queues, clocks, and counters. Are you prepared to observe this hidden land and find secrets the kernel keeps from us all? Presented as a guided exploration, this talk will focus on observing and understanding low level CPU performance. Starting from a common user-space program and working our way down we will demystify memory pages, CPU caches, instructions-per-cycle, and more. Along the way we will pull in Linux tooling to see these in a live system — catching the kernel in its lies. Finally, we will discuss how we can instrument production systems to measure low level performance and know when the kernel is telling us the truth and when we are silently leaving CPU cycles unused.
Watch
Monitorama PDX 2024 - The complexity of success and failure: the story of the Gimli Glider
Thai Wood's session from Monitorama PDX 2024. A look at monitoring, attention, incidents, and complexity through the lens of the story of the Gimli Glider, a plane that ran out of fuel mid-flight, but was able to be landed successfully on the ground anyways. I'll cover things like: * How dashboards and gauges can mislead, especially depending on the context around their usage and viewing * How expertise contributes to interpretation of monitoring and responding to incidents. * The negotiable, changing definitions of failure in an incident, that also mean some traditional forms of monitoring are insufficient. * How we, as an industry, can help make sure we have the right monitoring and resources in place to make a safe landing even when things go wrong.
Watch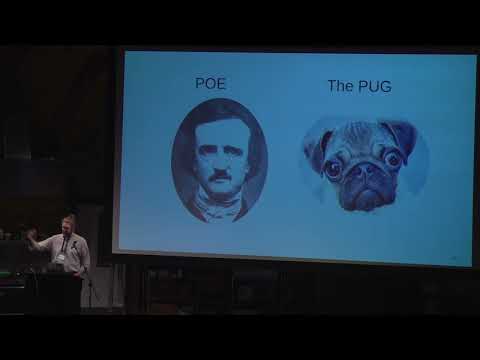
Monitorama PDX 2024 - Pugs, Poe's and pipelines; An engineering perspective on big-data streams...
David Josephsen's session from Monitorama PDX 2024. At scale, all Observability projects are data-engineering problems, which require big-data tools and techniques to solve. But many of these tools -- particularly general-purpose streaming frameworks -- often make less than ideal trade-offs which negatively impact latency, or make troubleshooting difficult. Meanwhile, a lot of purpose-built monitoring tool-chain either doesn't scale as well as it claims, or requires nefarious hacks to reach your target ingestion rate. In either case, these systems invariably wind up costing more than you intended. Whether you're designing a high-volume telemetry pipeline from scratch, or shoring up an existing system that's having trouble scaling, I want to share with you a powerful, reductive thought-pattern that has helped me build and maintain 5 different massive-scale telemetry pipelines in as many years. In this talk, I'll introduce you to my friends, Poe (point of enrichment) and Pug (Point uf aGGregation), and together we'll learn about how they can help you define your tooling requirements, reduce your end-to-end latency, and perhaps most importantly, control spend.
Watch
Monitorama PDX 2024 - How we tricked engineers into utilizing distributed tracing
Noa Levi's session from Monitorama PDX 2024. Strava implemented distributed tracing over 4 years ago, yet the tool has been historically underutilized. We’ve improved documentation, presented tech talks, and created training modules to increase the adoption of the tool, yet there was little to no change in tracing usage. Though underutilized, we’ve chosen to continue using and investing in improving our distributed tracing tooling given how impactful the tool is to those that do use it. This talk will explain how we inadvertently increased adoption and improved our distributed tracing tooling while migrating from OpenTracing to OpenTelemetry. The migration involved updating configuration, redeploying, and testing over 100 microservices. Strava’s platform team did not have the context to safely deploy and test those services, so that work was assigned out to each team at Strava. Practically what this meant was that every team ended up poking around our trace visualization tooling, many of them for the first time. Engineers were able to learn about tracing within the context of a service they were familiar with. Almost immediately, we noticed more engineers using the tooling and even making suggestions for improvements to enhance their data. While our intention of asking teams to migrate their own services was to prevent production downtime, there was a happy accident of increasing adoption.
Watch
Monitorama PDX 2024 - Experiments in Backing Prometheus with Clickhouse
Colin Douch's session from Monitorama PDX 2024. Columnar datastores like Clickhouse are becoming increasingly popular when it comes to bulk storage of Observability data. This is due to their efficient enabling of high cardinality and high dimensionality datasets that appear natively in Observability workloads. At the same time, one of the chief complaints about Prometheus is its seeming inability to handle these workloads, with common advice being to reduce labelsets as much as possible to reduce the load on Prometheus. With the invention of Prometheus Remote Write and Read however, we are empowered to experiment with alternative backing stores for Prometheus. In this talk, I will introduce a methodology for offloading Prometheus storage and retrieval to Clickhouse. Using that method, I will cover the ups and downs of using Clickhouse as an external Prometheus storage, including storage usage, query efficiency, and operational overhead, and opine on how parts of Clickhouses design might help inform Prometheus improvements in the future
Watch
Monitorama PDX 2024 - From Alerts to Insights: Performing Trace-Based Causation at Scale
Logan Rosen's session from Monitorama PDX 2024. Our team focuses on improving the observability experience for engineers at our company, specifically in triaging/performing causal analysis for alerts. Previously, we have taken a time-based correlation approach, which can yield success but is not always point to the right problem. Especially in a multi-layered stack of many microservices, we would often end up with red herrings when comparing metrics that seemed to match up in shape but didn't end up being related. It is important that we point engineers in the right direction, and quickly, in order to reduce the amount of time it takes to resolve site impact. To remedy this, we focused on leveraging distributed tracing for determining causation – by stream processing the events emitted at each hop of a request, we could deterministically point to the problems that led to the alerts very soon after they arise. Specifically, we could look at chains of errors and/or latency on a per-trace basis and use aggregate counts over time to provide a causal graph to engineers debugging site issues. We were able to build this by leveraging Go and Kafka, and it required significant amounts of performance tuning and careful coding to make it efficient as possible, given the immense scale of trace events being processed. The data coming out of this pipeline has shown tremendous promise, and we aim to surface it to our users by the end of this year/early 2024. This will be a structured talk that walks audience members through our journey of maturing our triage/RCA approaches and building this pipeline, as well as through the technical challenges we encountered/how we surmounted them. It is targeted at engineers looking to improve their observability tooling within their own organizations.
Watch
Monitorama PDX 2024 - From Polling to Streaming: Network Monitoring with Real-Time Telemetry
Tushar Gupta's session from Monitorama PDX 2024. In this talk, attendees will dive into the world of streaming telemetry, learning its basics and how it's better than old-school monitoring for watching over networks in real time. We'll walk through essentials of integrating streaming telemetry into network deployments, from setting up data sources and choosing the right transport protocols to interpreting the rich data streams to make informed decisions that can optimize network performance and reliability. This segment will also cover the best practices, based on insights from real-world implementations, needed to design and deploy robust telemetry solutions that enhance observability and drive operational excellence. The latter part of the talk will will touch on some of the considerations and common hurdles that come with implementing streaming telemetry, such as managing large amounts of data generated, its storage and prioritization. The talk will then delve into practical tips on how to handle the data effectively, aiming to equip attendees with the know-how to smoothly integrate streaming telemetry into their systems. The end goal of the session is for attendees to be able to assess whether streaming telemetry aligns with their needs and, if so, be able to implement it to leverage its advantages while sidestepping potential pitfalls.
Watch
Monitorama PDX 2024 - Serverless Observability: a case study of SLOs
Virginia Diana Todea's session from Monitorama PDX 2024. Fine tuning the Service Level Objectives is a golden rule for the industries adopting them. This talk explores the case study of migrating to Kubernetes and how SLOs and transforms can backfire if not managed correctly. The talk starts by presenting the reasons why SLOs are important in the software development framework. We will then present our case study on how migrating to Kubernetes exposed our system to SLO definition and the challenges our system faced when trying to measure and adhere to our SLOs. We will deep dive in the main bottlenecks we encountered when trying to apply our SLOs across our multi cluster infrastructure, how we dealt with these challenges by correlating our SLOs with burn rates and transforms. We highlight that the observability system can backfire as a consequence if the metrics are not properly adjusted. We wrap up our talk by drawing the main lessons from our case study and the benefits to the ecosystem: SLOs are paramount for the software development lifecycle and implementing them correctly should follow a process of continuous improvement alongside with adopting the right tools and metrics.
Watch
Monitorama PDX 2024 - Distributed Tracing - All The Warning Signs Were Out There!
Vijay Samuel's session from Monitorama PDX 2024. We've all heard it time and time again - "distributed tracing is hard". The sad reality is that there is a lot of truth to this statement. All too often we keep hearing buzz words and statements around how magical distributed tracing is and how it can easily cut down time to triage. However, when we talk about tracing at scale with ~5000 micro services and 100s of databases, the nuances of tracing start bubbling up pretty fast. Some of which include: * infinitely large trace waterfalls that become hard to grasp * A handful of mis-instrumented applications that lead to lost confidence in the system Many early adopters told us that it would be hard and we tried different techniques to mitigate some of those issues early but we ultimately hit the wall of pain. This talk describes how these real problems affect the Observability team at eBay and how we are approaching these problems to hopefully make tracing work in the future.
Watch
Monitorama PDX 2024 - Welcome to the OTEL California
Matt Macdonald-Wallace's session from Monitorama PDX 2024. What kinds of surprises await you when implementing Open Telemetry, and will OTEL help you hold a mirror to your code? In this 30 minute talk, Matt Wallace will take you through his journey so far, including the pitfalls and prizes he's found along the way. Focusing on Python, and without any apologies for the title of the talk, Matt will answer such questions as: * Can I use OTEL to avoid vendor lock-in? (Yes!) * Should I be using OTEL? (Also yes!) * Is auto-instrumentation enough? (Maybe?) * Should I get disheartened if my application service maps don't show the right connections straight away? (No!) If you're new to OTEL or trying to work out how you escape vendor lock-in with application observability for the future, this session will guide you through everything you need to know to make the most from this free, open, and rapidly developing framework.
Watch
Monitorama PDX 2024 - Tracing Service Dependencies at Salesforce
Sudeep Kumar's session from Monitorama PDX 2024. This talk will focus on our strategic choice to utilize a streaming pipeline for inferring service dependencies using Trace telemetry data. We'll also delve into a key use case that showcases how service dependencies are visualized and managed through the streaming pipeline on our distributed tracing platform. These service dependency views are crucial for monitoring the deployment status of services and the health of related services. Moreover, by providing a clear overview of service interactions, we also facilitate risk assessment for new feature rollouts, enhancing both product development and operational stability. Additionally, discuss the role of integrating service mesh onto Kubernetes led to comprehensive coverage and completeness of our service dependency data. Also In our talk, we'll will explore how a Flink based streaming platform and Druid backend is utilized to gather all trace telemetry data, enabling us to process 100% of trace data (from 300 millions spans collected per minute) and deduce complete trace contexts. By establishing unique trace contexts, we create a trace state that represents every request occurring within the system. This state (Dependency edges) contains vital information required to map out the path of transactions as they move through different services and components within Salesforce. Our proposed talk will delve into the transformative process of converting individual trace states into service dependency edge records through Flink and Druid, revealing the complex web of interactions between services. Attendees will be equipped with methods to uncover key interactions, such as identifying the services or operations that most frequently initiate contact with other services. Furthermore, we will explore strategies for utilizing service dependency topology to achieve a thorough grasp of the relationships and dependencies among services and components in a distributed system. Adding to the benefits, the audience will learn how having service mesh coverage on any Kubernetes infrastructure can be leveraged effectively for accurately deducing service dependencies. This aspect underscores the importance of infrastructure design in enhancing traceability and reliability within distributed systems. Armed with this understanding, participants will be better positioned to enhance system performance and reliability. The session aims to provide attendees with actionable insights and methodologies for effectively managing and navigating the intricate service dependencies that characterize modern distributed systems.
Watch
Monitorama PDX 2024 - Distributed Context Propagation: How you can use it to Improve Observability..
J. Kalyana Sundaram's session from Monitorama PDX 2024. One of the main challenges in a complex distributed system is: How do we get all the participants on the same page about the “shared context” of a logical request? How do we do that in a vendor neutral and interoperable way? Say hello to distributed context propagation, also known as Baggage. In this session, Kalyan will cover the "what", "why", and "how" of distributed context propagation. Baggage enables a variety of use cases in two categories: 1) improving the observability of a system and 2) enabling better control of a system. You will learn about use cases such as labelling synthetic traffic, chaos engineering, and attributing infrastructure spend. Kalyan represents the work done by the W3C Distributed Tracing Working Group that is driving the standardization of this mechanism (W3C Baggage). He will build together with you in a bottom-up manner the building blocks for solving this problem, and then extend that solution to be open and interoperable. You will also see a live demo of this built using the OpenTelemetry Baggage APIs.
Watch
Monitorama PDX 2024 - Use counters to count things
Fred Moyer's session from Monitorama PDX 2024. eBPF, OTel, TSM, data lakes, observability. All this cool new stuff. But you know what's really cool? Counting things. Lots of things. One, two, three, 18,446,744,073,709,551,615. Can your system count that high? And how fast can it do that? Being able to count certain things in your business quickly and efficiently is important to establishing business goal and understanding where you stand from both a business and technical health perspective. Counting lots of things is also genuinely interesting computer science problem. And in the monitoring realm, there are tools which use statistics to figure out how many distinct things are in a large pile (from a monitoring prospecting). One classic example is "How many times did users hit this API endpoint?" Inquiring product managers want to know. There are easy ways to do this, and there are hard ways, and there are ways in between, all with different tradeoffs. This talk will look at the different ways this problem can be approached and what business requirements drive those technical approaches. Should you count up logs? Should you bump a StatsD artifact? Should you consult a staff data scientist? You shouldn't be using the same approach from startup to mega corp, so you'll get a walk through the tradeoffs from practical experience across all those ranges.
Watch
Monitorama PDX 2024 - The shoemaker’s children have no shoes - why SRE teams must help themselves
Pete Fritchman's session from Monitorama PDX 2024. There’s an old proverb that says ‘the shoemaker’s children have no shoes.’ In other words, people with specific skills or who offer in-demand services are often so busy providing their expertise and service to others that they aren’t able or don’t have the time to provide it to themselves. The same could be said of SRE teams and internal services, and has never been more true for developer tooling and workflows. SREs are laser-focused on ensuring a great experience for customer facing applications but their own internal services, and their internal users, can sometimes go neglected. It’s time for the shoemaker to give their children shoes! In this 30-minute talk, Pete Fritchman, staff infrastructure engineer at Observe, will offer guiding principles and practical examples to get SRE team members thinking about how they handle internal services and customers. Fritchman will also explore how organizations are putting themselves at risk as well as outline best practices that must be taken to adequately support internal services.
Watch
Monitorama PDX 2024 - Incident Management: Lessons from Emergency Services
Julia Thoreson's session from Monitorama PDX 2024. What do missing people, production outages, and natural disasters all have in common? They are all different types of incidents! Although these may seem like completely unique situations, similar principles and processes can be applied in all kinds of challenging circumstances. Drawing on my experience as both a software engineer at Bloomberg and a Lieutenant on the Alameda County Search and Rescue Team, we will discuss pre-planning, alerting, responding and debriefing for all sorts of incidents.
Watch
Monitorama PDX 2024 - No observability without theory
Dan Slimmon's session from Monitorama PDX 2024. When our system isn't observable enough, what do we do? We add telemetry. The more signals we can observe, the more knowledge we'll have. Or so the thinking goes. But observability requires more than just data: it requires a _theory_ about how our system works. Only within a theory can signals be interpreted and made useful. In this talk we'll see that, often, the limiting factor of a system's observability is not the thoroughness of our measurements, but rather the strength and coherence of our theory. This fact carries major implications for how we must build dashboards, write alerts, and respond to incidents.
Watch
Monitorama PDX 2024 - Disintegrated telemetry: The pains of monitoring asynchronous workflows
Johannes Tax's session from Monitorama PDX 2024. Many tools and best practices around instrumentation and observability are tailored to synchronous request/response workflows, HTTP and RESTful APIs being the most prominent examples. However, if you have to instrument and monitor a system that relies on asynchronous communication based on events or messages, you'll soon find out that established concepts and practices don't work so well. Observing loosely coupled processing steps often leads to disintegrated telemetry, which makes it hard to derive actionable insights. In this talk, I focus on the challenge of correlating the disintegrated telemetry pieces (metrics and traces) that are emitted during the lifetime of a message or an event. I describe the problem and present possible solution approaches. I show how each solution approach is broken in its own way, and provide insights that help you to choose the least broken solution for your scenario. Finally, to show some light at the end of the tunnel, I give an overview of standardization efforts in this space, including W3C context propagation drafts for messaging protocols, and the messaging semantic conventions created by the OpenTelemetry messaging workgroup, which I'm leading.
Watch
Monitorama PDX 2024 - The Hater's Guide to Dealing with Generative AI
Phillip Carter's session from Monitorama PDX 2024. Generative AI! LLMs! They're all the rage! ...and for good reason. Unlike crypto, this new phase of AI is a legitimate step change in capabilities, with companies in every economic sector finding places where it can add value. People are experimenting and C-levels are rewriting roadmaps to incorporate this tech. It's here, it'll probably stay, and we're gonna have to make it work. So, how do you make this stuff work in the long run? You guessed, it Observability! LLMs are black boxes you can't debug in the traditional sense. The most effective way to improve them over time is to put them into production, gather good telemetry from real-world usage, and analyze that data to figure out how to improve answers. In this talk, you'll learn the basics of what you need to track, how you can track it, how you should consider monitoring health of an LLM over time, and how you can add value to your organization by feeding valuable data back into the development process.
Watch